Using graphical abstracts to enrich and expand the reach of your research
May 6, 2021
By Ginny Pittman, Sarah Pratta
Graphical or visual abstracts increase utility and readership in a bite-sized, visual format
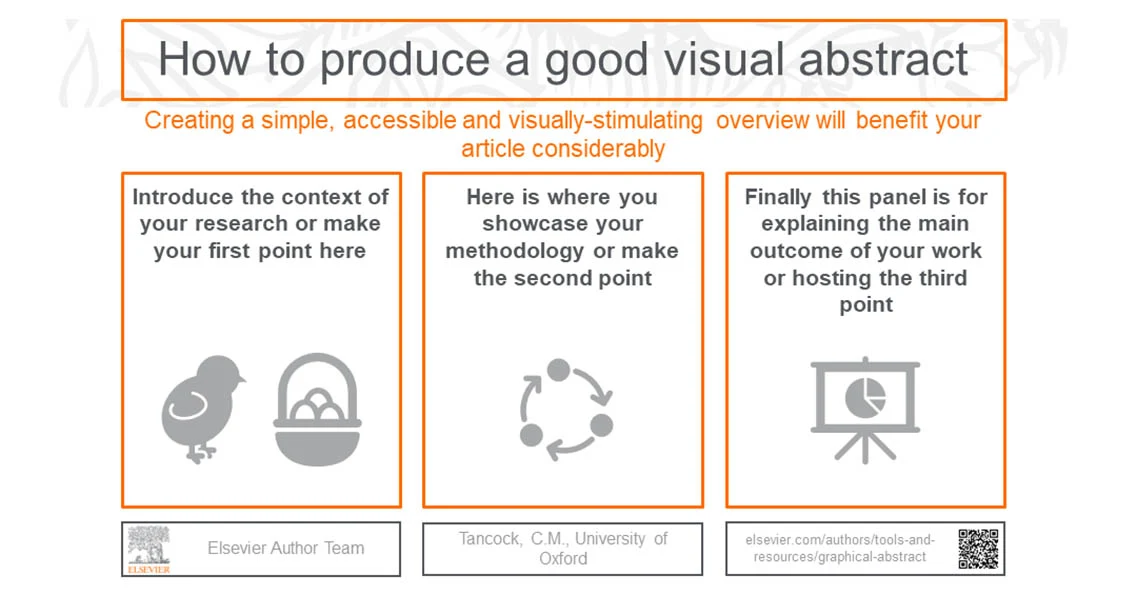
This graphical abstract template is from Elsevier's tools and resources for authors
In the ever-evolving world of scholarly communications, authors and journal editors all aim to broaden the reach of their articles and make it easier to understand their key research findings. Graphical abstracts, also known as visual abstracts, are one way to do this.
If your journal or society hasn’t started using graphical abstracts, or you are looking at ways to optimize their style and distribution, here are a few things to consider.
What is a graphical abstract?
Graphical abstracts are a visual summary of the main findings of a study, designed to help readers understand the key takeaways. They can be in any format, from simple image files to complex graphs and charts created with specialist software.
Why should journals use graphical abstracts?
Readers and researchers have less time than ever to read full-length articles, so graphical abstracts help people quickly decide if they should read the full study. They also help them better retain the information (visual summaries can be easier to remember than basic text, tables and charts). Authors frequently make use of graphical abstracts to share their research in talks, presentations and on social media which increases an article’s dissemination and presents opportunities to extend your journal brand.
In an increasingly online world where researchers are faced with information overload, graphical abstracts grab people’s attention, especially when used on social media. Research shows that visibility and engagement increases when they are shared on sites such as Twitter.1 This in turn can help increase readership, engagement with your content, and visibility for your organization.Many of our society partners, including the International Society of Nephrology(opens in new tab/window) with their journal Kidney International(opens in new tab/window) and the American College of Emergency Physicians(opens in new tab/window) with Annals of Emergency Medicine(opens in new tab/window), use graphical abstracts to better showcase the research published in their journals and engage with their members.
How to get started
There are a few things to consider before implementing graphical abstracts for your journal. One is how to position them relative to the main article. Will the graphical abstracts be published alongside the article itself, or will they be used solely for social media and other promotions to drive traffic to the article? Increasingly, journals are publishing the graphical abstract with the article online as it’s seen as an integral part of the article. Transparency with authors is critically important, so if your journal decides to use graphical abstracts for post-publication only, authors must be informed and ideally should be tagged in the social media posts.
Who creates graphical abstracts?
Graphical abstracts are most often created by authors, but some journals make use of social media editors, society staff or designers to create or edit them. If authors create the graphical abstract, it is preferable to request it at revision stage to avoid unnecessary work for the author should their article get rejected. If a social media editor or society staff member creates or edits the graphical abstract, you need to ensure the workflow includes a step for the authors to review and approve.According to Alina Foo, Associate Managing Editor of the American Journal of Kidney Diseases(opens in new tab/window):
"We started our visual abstract program in 2017 by selecting an article a month and asking members of our Social Media Advisory Group to create the first draft, which would then be revised by the editors and sent to the authors for approval. Eventually we started an Editorial Internship program and asked our Editorial Interns to draft the visual abstracts instead. This year, we decided to expand the visual abstract program by inviting authors to submit their own visual abstracts with their revised articles.
It has been a learning process for all of us – authors, editors and staff – to understand what makes a good (not perfect) visual abstract, and we continue to strive for accuracy, clarity, and simplicity when we get to the editing phase."
How do you design a graphical abstract?
The most common format is a PowerPoint slide, which allows sufficient space to include the images used to convey key messages as well as metadata about the article and journal. The key components typically include:
The graphical abstract title
The main section visually representing the methods/cohort, results and conclusions
The names of the authors of the study and citation.2
Increasingly, journals are creating their own branded templates for graphical abstracts to ensure a consistent look and feel across all published abstracts.
The graphical elements should be designed to represent the research findings. Authors should be discouraged from simply using figures from the article itself. It is also important to take a “less is more” approach; keeping the design simple and including ample white space will allow the main messages to come through.
Finally, you’ll want to incorporate clear instructions on how to create a graphical abstract into your Guide for Authors.
How to publish and share
Now that you’ve created an attractive visual summary, it’s important to publish and share it effectively. Graphical abstracts are often published as an online-only image with the article HTML, but they can also be e-appended to the PDF of the article. Some journals also feature them on their website in an image carousel or a featured graphical abstract section.
Authors increasingly use graphical abstracts in poster presentations or talks at academic meetings, but the main dissemination method is through social media on Twitter. There is evidence to suggest that engagement with a journal’s tweets improve when they include a graphical abstract, and journals are increasingly adopting graphical abstracts as a main part of their social media strategy.3
As Alina Foo explained:
"It is more effort up front, but once finalized, visual abstracts can be utilized in a variety of ways: included with the article, shared on social media platforms, highlighted on journal homepage or collection, and featured in conference slides, presentations and journal clubs. We encourage all journals to utilize visual abstracts as a tool to disseminate their authors’ work more widely."
References
1. Peter Gloviczki, MD (Editor) and Peter F.Lawrence, MD (Editor): Visual abstracts bring key message of scientific research(opens in new tab/window), Journal of Vascular Surgery (May 2018)
2. How to produce a good visual abstract, Tools and resources for authors (Elsevier)
3. Everly Ramos, MD, and Beatrice P Concepcion, MD: Visual Abstracts: Redesigning the Landscape of Research Dissemination(opens in new tab/window), Seminars in Nephrology (May 2020)
Contributors
GP
Ginny Pittman

SP